


Cell phones and the networks they run on have become ubiquitous personal computing devices that help us navigate and interact with the city. We use our mobile devices for almost everything that we do from talking on the phone, navigating the city, personal banking, email, and surfing the web. As we interact with these devices we leaves bits of information about what we are doing at the location we are performing them. Visualizing and analyzing this data holds much potential for developing new viewpoints, understandings, services and opportunities for the cities we live in.
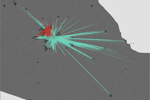
Ratti and Williams (2005) study of Vodafone data in Milan showed that cell phones could help to improve transportation networks and can provide helpful assistance during natural disasters. Recently Reades (2007) study of UK cell phone data has shown how it can be used to highlight areas in the UK that are connected with each other, allowing use to highlight spatial connections within regions. Rojas (2010) has begun to look at how cell phone technology can be used to understand the connections between immigrant communities and their home country.
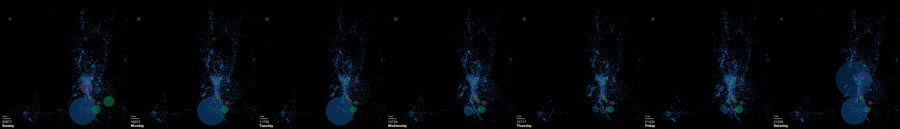
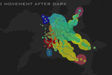
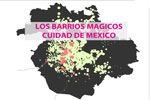
In partnership with Telefonica we will explore what Telefonica cell phone data can tell us about the city and their inhabitants' behaviors by experimenting with the data to create visualizations that tell compelling stories and provide new vantage points to understand the city and the data itself. The class will focus on results that create compelling visuals that highlight patterns that might not have otherwise been seen in the city, thereby highlighting new vantage points of the data that might not have otherwise been seen. In order to do this, students will have to become familiar with the data itself, through exercises that help extract subsets of the data. Student will investigate Telefonica data in comparison with other traditional/governmental data sets, this means that they will learn how to identify and extract these datasets. Student will also learn how to represent the data using programs such as processing, ArcGIS, and other visualization software. This research will be contextualized by readings about the possibilities of data and technology in the City, including works by Castells, Mitchell, Ratti, Sassen, and others.
Inspired by the understanding of patterns and behaviors of the city and it's inhabitants students will sketch high level starting points for new opportunities in urban space that this data my hold based on the conclusions and viewpoints gained through the visualizations of the data. Due to the multidisciplinary nature of the course and the diverse background of the students these opportunities can range from urban planning solutions to novel approaches to architecture to services or other outputs and will be used to create a tangible understanding of the impact that this data may have in the future.