


Doneliza is an urban planning master's degree candidate at Columbia University's Graduate School of Architecture, Planning and Preservation.
Final Visualization
Mexico City has one of the largest metro systems in the world, serving over 1.4 billion passengers annually. However, the Mexico City Metro closes at midnight and does not begin service again until 5am on weekdays, 6am on Saturdays, and 7am on Sundays and holidays. What happens when the metro is asleep?
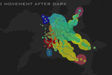
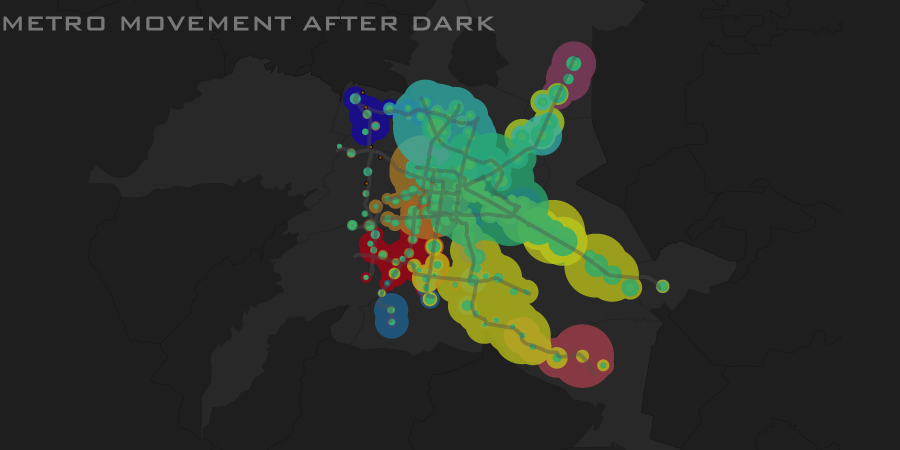
My final product for the course was the creation of the website, Metro Movement After Dark, which allows users to explore how people moved along the metro lines during the hours when the metro was closed. Users can see where people moved from metro stations in one borough to the other metro stations throughout the system during Mondays between 12am and 5am.
There are two visualizations for each borough to show levels of connectivity. The map portion indicates movement between 12am and 5am from the origin borough to other stations along the metro line with the radius of each circle proportional to the probability of movement from the origin borough to the receiving station.
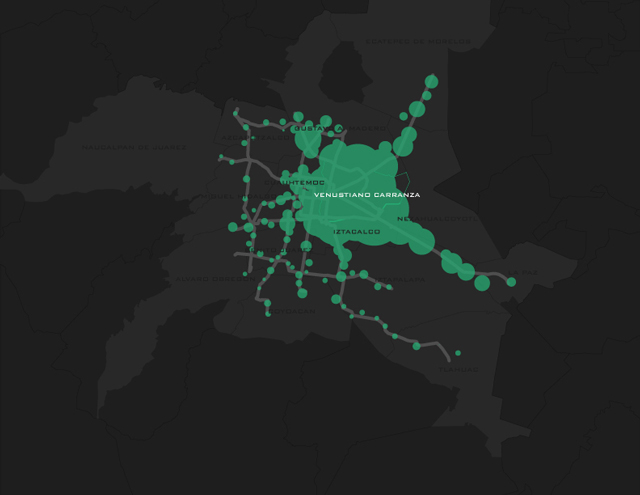 Image 1 indicates the movement from the borough Venustiano Carranza along the subway line during overnight hours.
While the map shows all the connections of the origin borough throughout the system, the second visualization is the wheel, which indicates only the boroughs to which the origin borough is highly connected.
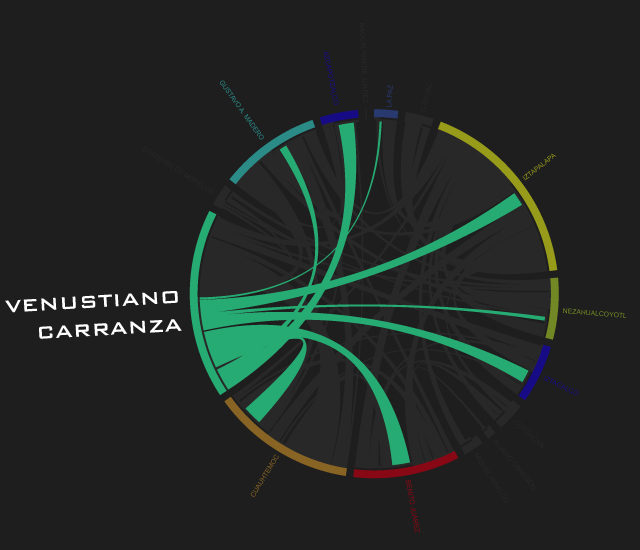 Image 2, the Venustiano Carranza wheel, indicates high levels of connectivity with other boroughs.
I proposed that this visualization could be beneficial for transportation suppliers to consider providing new or additional services including, buses, taxis, or potentially overnight metro operations between origins and destinations with high levels of connectivity during overnight hours.
Process
The final visualization was a culmination of weeks of mining the Telefonica data and drafting visualizations to create a story for a specific user group. One of the first assignments "10 Sketches" was meant to quickly show how we had begun exploring the large data set. While doing background research on Mexico City, I came across a Mexico City metro kml file (mexicocity.org) and was interested in seeing how the Telefonica data corresponded to the metro system. Two of my original sketches showed population movement along the metro.
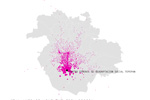
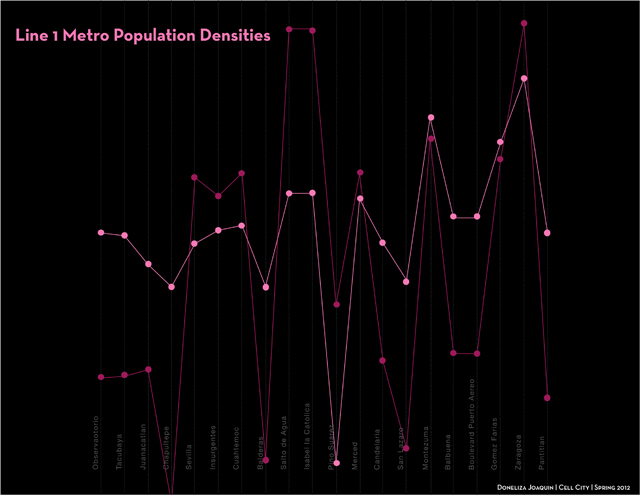 Image 3 is a chart, which compares weekday and weeknight population along metro line 1.
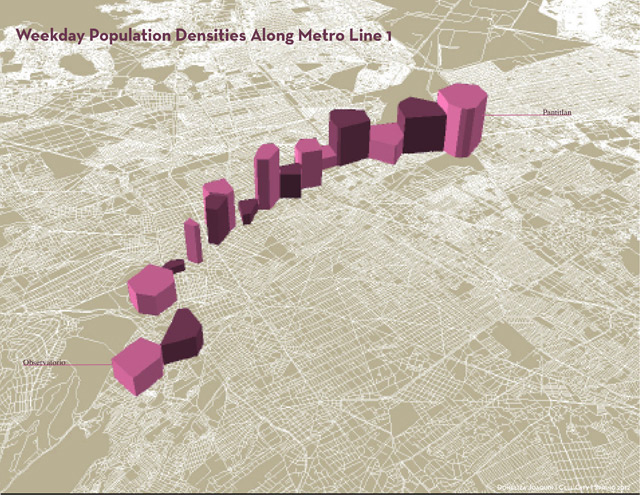 Image 4 indicates the weekday population densities along metro line 1 with the polygons representing the Base Transfer Stations with a service area that intersects the metro stations along the line, extruded proportionally to the population density associated with the voronoi.
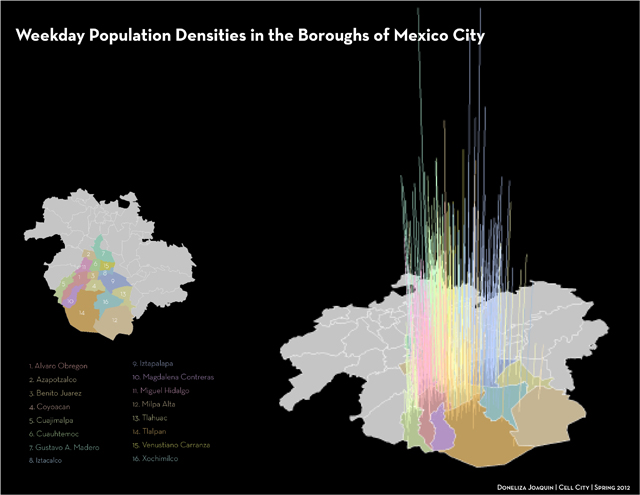
Some of my other favorite early sketches from the 10 Sketches assignment were Image 5 in which I showed the population densities of the boroughs of Mexico City as extruded lines color-coded by borough.
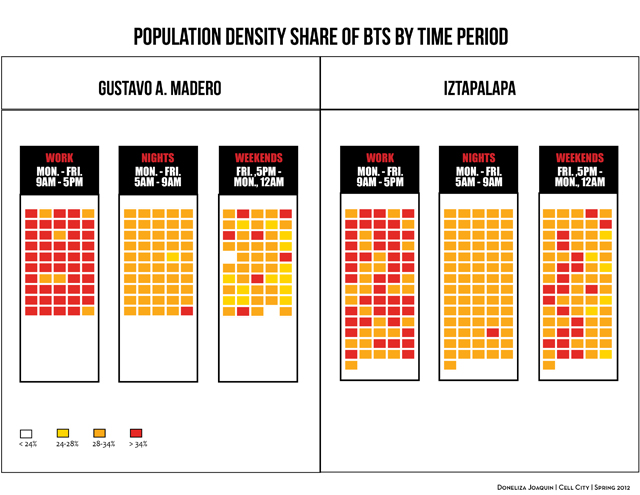
Trying to visualize the data beyond maps, Image 6 shows the BTS of two boroughs in Mexico City and indicates when each BTS is most active either during the weekdays, weeknights, or weekends.
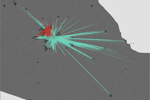
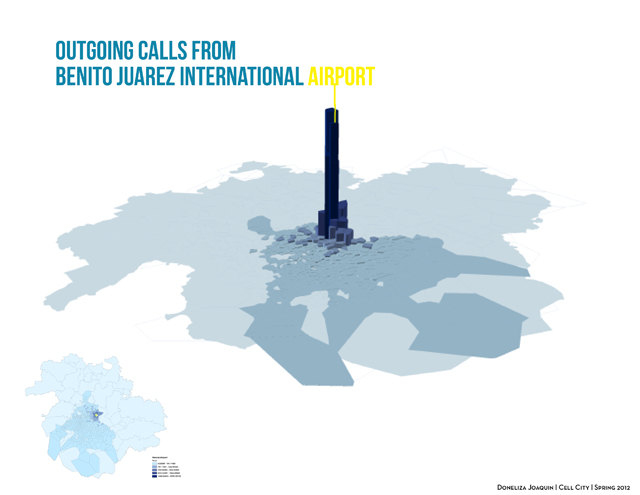
In addition to my interest in the metro system, I was interested in looking at specific trip or call generators such as an airport. Image 7 shows the outgoing calls from the BTS which includes the Benito Juarez International Airport to other BTS in the city, with voronoi polygons extruded to the volume of receiving calls.
I began to focus my visualization to target transportation providers, in particular for late night movement. Image 8 shows the voronoi polygons with high call volumes during weekend overnight hours 10pm to 4am, in dark blue.
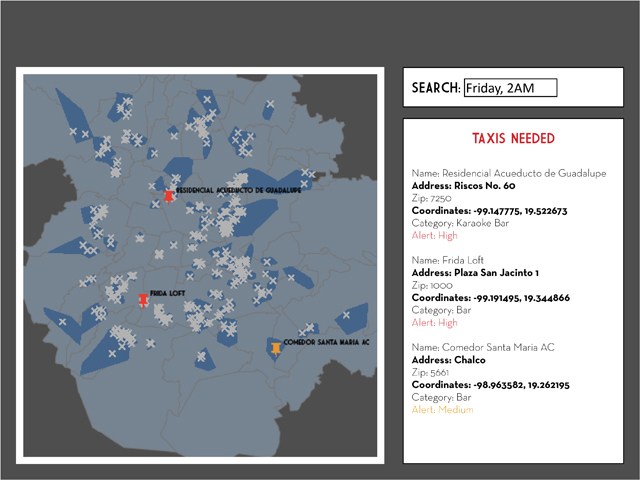
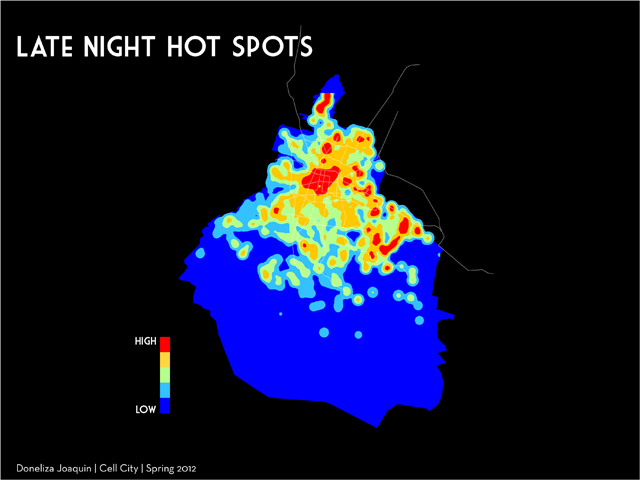
Combining the Telefonica data with foursquare data, all the "x"-es mark venues labeled as bars that fall within the voronois with high levels of overnight activity. The idea was that taxi drivers could benefit from finding hotspots of late night activity. Similarly, Image 9 visualizes a hot spot analysis I conducted of call volumes within Mexico City during overnight hours.
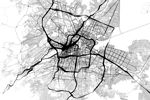
My original proposal for my final product was to redraw the subway lines of the city based on high levels of connectivity between stations, as shown in Image 10.
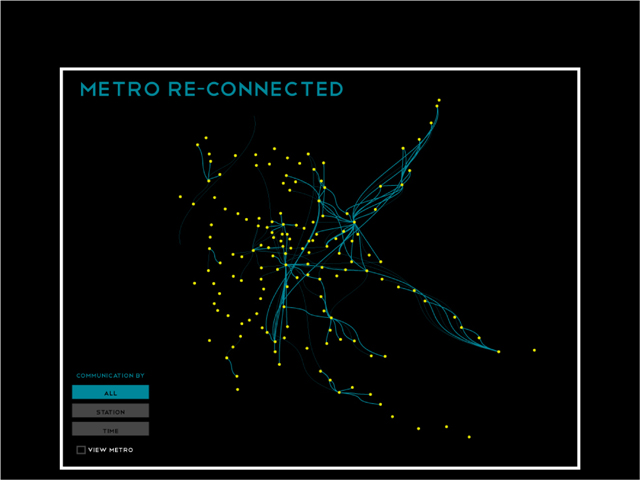
As I further explored the data I continued to explore how the metro stations, voronois that intersected the stations, and boroughs were connected, and it all led me to Metro Movement After Dark.